
A vertically-polarized upper mantle shear speed model of the North American continent
(Jump to Model Downloads)

Tectonic map of the North American craton, based on Whimeyer and Karlstrom (2007).
SL2013NA is a new model of the upper mantle beneath North America and surrounding regions, including the Arctic, Greenland, Pacific and Atlantic Oceans, Gulf of Mexico, and Central America. The model is based on SL2013sv, however with an updated dataset including more recent USArray Transportable Array and global network stations to improve resolution across the continent. For details on the methodology, please refer to SL2013sv Page (and Reference). Here we limit discussion to the new data that was added for this model, and the results.
Data – The recently published model SL2013sv was constructed using a dataset of 712 thousand vertical component waveform fits, generated using the Automated Multimode Inversion (AMI, Lebedev et al, 2005) of surface and S waveforms. The seismograms were recorded by more than 100 international, national, regional, and temporary arrays from the 1980’s until March 2010. Here, we have augmented this dataset with an additional 240 thousand waveform fits computed for stations of the GSN and USArray, up to June 2012. The addition of two more years of USArray, with new station locations in the eastern US, can be expected to improve imaging resolution in the central and south-eastern US, as well as in Canada (due to the paths that sample north of the border). Our resulting master dataset now consists of almost one million successfully fit vertical component seismograms. The events used are those in the Global Centroid Moment Tensor (CMT) catalogue (e.g., Ekstrom et al 2012).

Station map showing both the global and North American stations as red triangles, the events used as grey squares, and the grid of model knots (light grey circles) in the study region.
From these one million waveform fits, a subset of the most mutually-consistent seismograms were selected using outlier analysis; the original 510 thousand from SL2013sv were retained, along with 211 thousand from the new dataset. The input dataset for SL2013NA is approximately 720 thousand seismogram fits. Of there, ~230 thousand belong to the Transportable Array, with an additional ~40 thousand being USArray affiliated.
Results – Our new isotropic upper mantle and transition zone Sv velocity model, SL2013NA, is computed on a ~280 km triangular grid using more than 700,000 vertical component broadband seismograms. The final model has a variance reduction of 90%. In the horizontal slices plotted at right, perturbations are with respect to the mantle reference, indicated at the top right corner of each panel. Perturbations are plotted in percent, with the maximum range and saturation indicated beneath each panel.
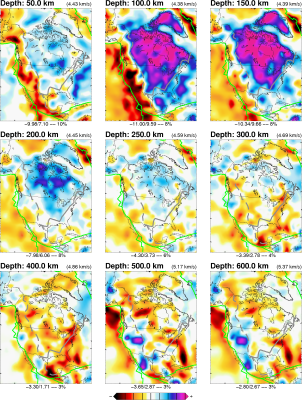
Maps of lateral variation in shear speed in North America at nine different depths through the upper mantle: 50, 100, 150, 200, 250, 300, 400, 500, and 600 km depth. Variations are plotted in percent (saturation indicated bottom right of each panel) from the mantle reference velocity (top right corner of each panel). Dashed grey line indicates the surface expression of the Rocky Mountain Front, whereas light-green lines denote the major plate boundaries.
Comparisons – We compare our new model SL2013NA with seven other global tomographic models, DR2012, SEMum, S40RTS, CUB, S362ANI, LH2008, and S20RTS, at 150 km depth.

Maps of lateral variation in shear speed in North America at 150 km depth for eight different models: SL2013NA and seven global tomographic models DR2012, SEMum2, S40RTS, ND2008, LH2008, CUB, and S362ANI. Perturbations are plotted in percent from the mean value at that depth for each model. The colour scales are saturated at 8%. Maximum perturbations are indicated beneath each panel.
Below, we compare SL2013NA with past continental- and regional-scale tomographic models, NA04, NA07, wUS-SH-2010-S, DNA10-S, WCUS, NWUS11-S, SIG11-P, and MIT11-P.

Maps of lateral variation in shear speed in North America at 150 km depth for nine different models: SL2013NA and eight continental- and regional-scale tomographic models: NA04, NA07, SAWum_NA2, wUS-SH-2010-S, DNA10-S, WCUS, NWUS11-S, SIG11-P, and MIT11-P. Perturbations are plotted in percent from the mean value at that depth for each model. Maximum perturbations are indicated beneath each panel, along with the colour scale saturation.
Structure of the North American Lithosphere – Below we focus on the lithospheric structure of the North American continent as imaged by SL2013NA. On the left is 100 km depth and on the right 150 km depth. Tectonic features based on those from Whitmeyer and Karlstrom (2007) are superimposed. Sub-panels in the bottom-left corner for each depth illustrate the strength of lateral velocity gradients, in units of %/100 km. At 150 km, diamondiferous and non-diamondiferous kimberlites are indicated by green and grey diamonds (respectively).

Model Download
We have provided two different versions of the model to download, which are on two different horizontal grids. The first archive, SL2013NA_tri-grd, contains a file expressing the model perturbations on the original ~280km triangular grid used in the inversion. The second archive, SL2013NA_0.25d-grd, contains the model re-gridded to a constant resolution of 0.25 degrees laterally. Each archive contains a README file identifying the model file and its format. The model begins at 20km depth, and contains the values with respect to our 3D reference model.
The format is explained in the README file. Several options are provided for plotting: perturbations with respect to our (3D) reference model, Absolute Velocity, or perturbations with respect to the mean velocity at a given depth. Feel free to contact the authors if you are unclear of the differences.
If using the model, please reference:
Schaeffer, A. J. and S. Lebedev. Imaging the North American continent using waveform inversion of global and USArray data. Earth and Planetary Science Letters, 402, pg 26-41, 2014. doi:10.1016/j.epsl.2014.06.014. [Link]
Version 1.1a: Absolute 1D Profiles (April 2018):
- SL2013NA_0.5d_1DAbs_v1.1a.tgz – Added archive of complete 1D profiles extracted for the SL2013NA model at 0.5 degrees laterally within the model region. These 1D profiles include the discontinuity structure of the reference model. Complete Vp/Vs/Density profiles are present, however we highlight that the inversion itself was focused on the accurate recovery of Vs and not the other properties.
- SL2013NA_0.25d_1DAbs_v1.1a.tgz – Added archive of complete 1D profiles extracted for the SL2013NA model at 0.25 degrees laterally within the model region. These 1D profiles include the discontinuity structure of the reference model. Complete Vp/Vs/Density profiles are present, however we highlight that the inversion itself was focused on the accurate recovery of Vs and not the other properties.
Version 1.1 (August 2016):
- SL2013NA_tri-grd_v1.1.tar.bz2 – README Updated with new contact information.
- SL2013NA_0.25d-grd_v1.1.tar.bz2 -README Updated with new contact information.
Version 1 (July 2014):
- SL2013NA_tri-grd_v1.tar.bz2 – Triangular model shell knots (7, 842 shell knots at each depth).
- SL2013NA_0.25d-grd_v1.tar.bz2 – Gridded 0.25 degree lateral resolution spanning the model region in the above plots.

Thanks for sharing the model!
LikeLike